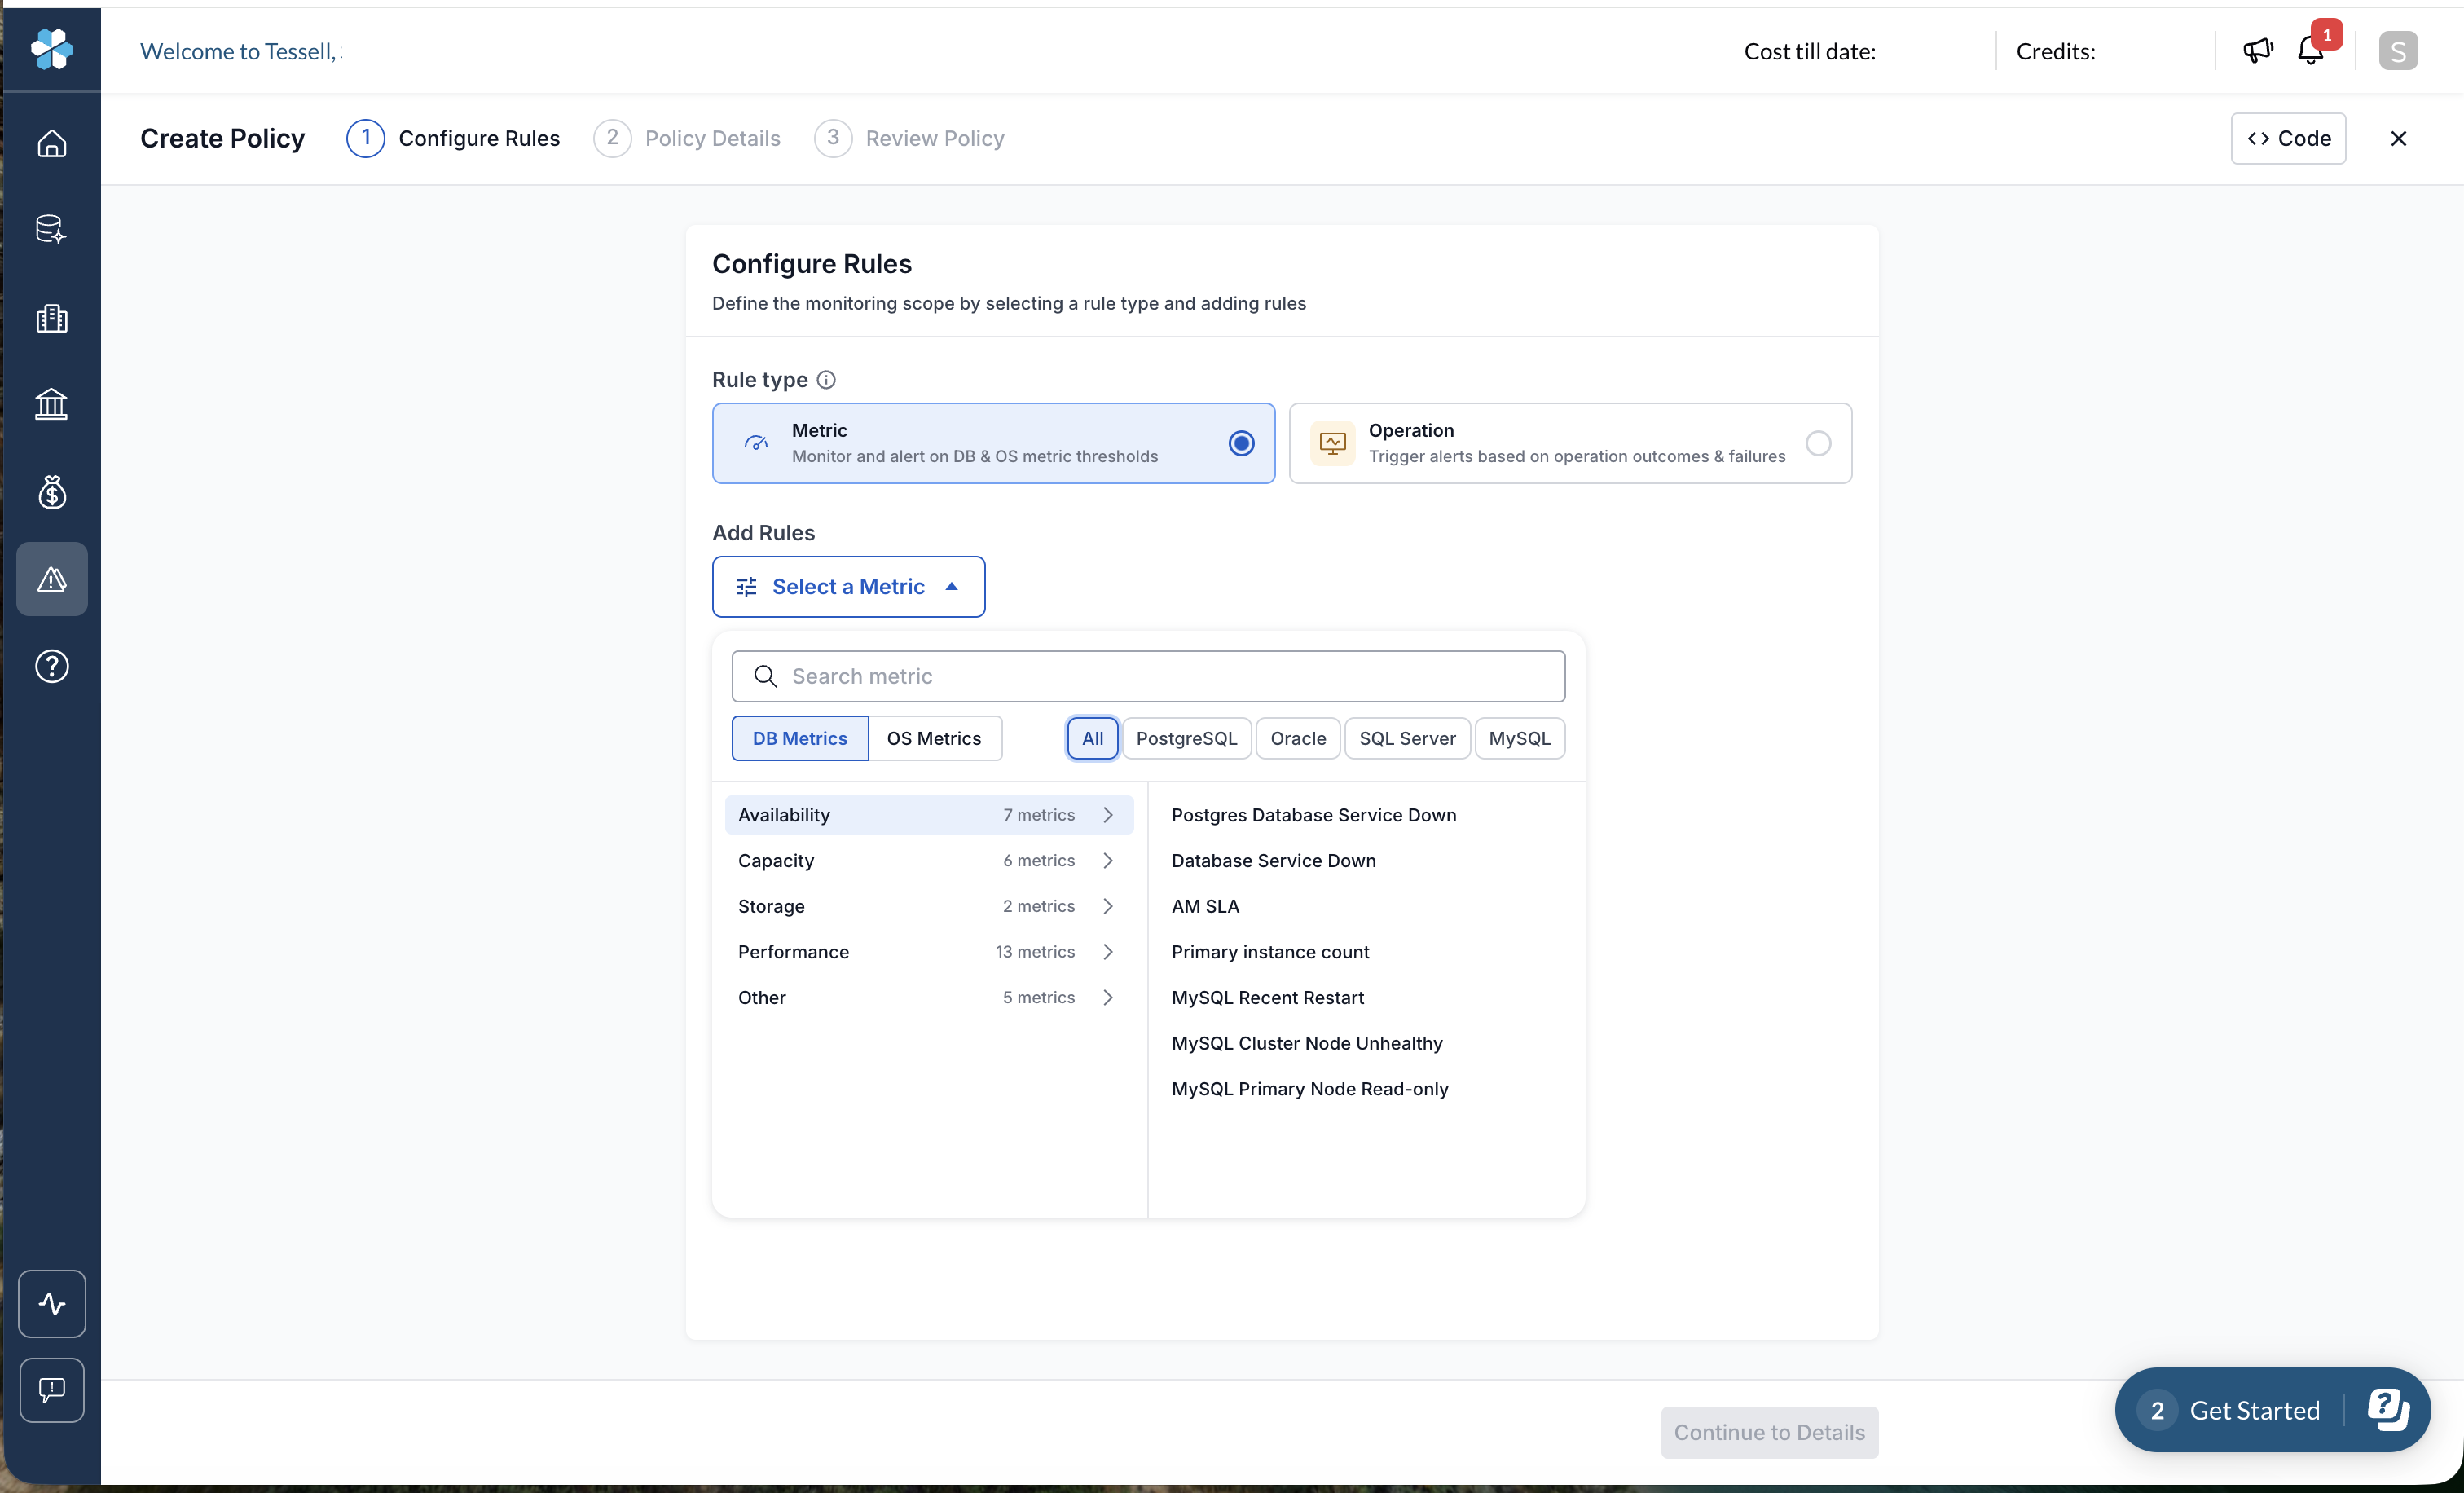
Figure 1 — Selecting Metric or Operation as the rule type
## What severity levels are available? Every rule, regardless of rule type, is assigned a severity. Severity determines how an alert is labeled and prioritized when it's triggered. | Severity | Typical use | | ------------ | ------------------------------------------------------------------------------------------------------ | | **Info** | Informational — tracks an event that doesn't need action, such as an operation completing successfully | | **Warning** | Flags a condition worth keeping an eye on, but not urgent | | **High** | Flags a condition that needs attention soon | | **Critical** | Flags a severe condition that needs immediate attention | You can assign different severities to different conditions within the same rule. For example, a Metric rule can fire as **Warning** at one threshold and escalate to **Critical** at a higher threshold, and an Operation rule can fire as **Info** on success and **Critical** on failure. *** ## Channel Settings Channel Settings is where you configure how and where alert notifications are delivered. It has two tabs: **Channels** and **Channel Groups**. ### What is a channel? A channel is a single notification destination — an email address, a Slack channel, or a webhook endpoint. You can add as many channels as you need. #### Add a channel 1. Go to **Channel Settings** > **Channels**. 2. Select **+ Add Channels**. 3. Select a channel type: **Email**, **Slack**, or **Webhook**. 4. Enter a **Display Name** to identify the channel. 5. Fill in the fields specific to the channel type: | Channel type | Fields | | ------------ | --------------------------------------------------------------------------------------------------------- | | Email | Email Id | | Slack | Slack Channel Name, Slack API URL | | Webhook | Endpoint URL, and Headers — either **HTTP Basic Auth** (Authorization, Token) or **API Key** (Key, Value) | 6. Select **Add Channel**.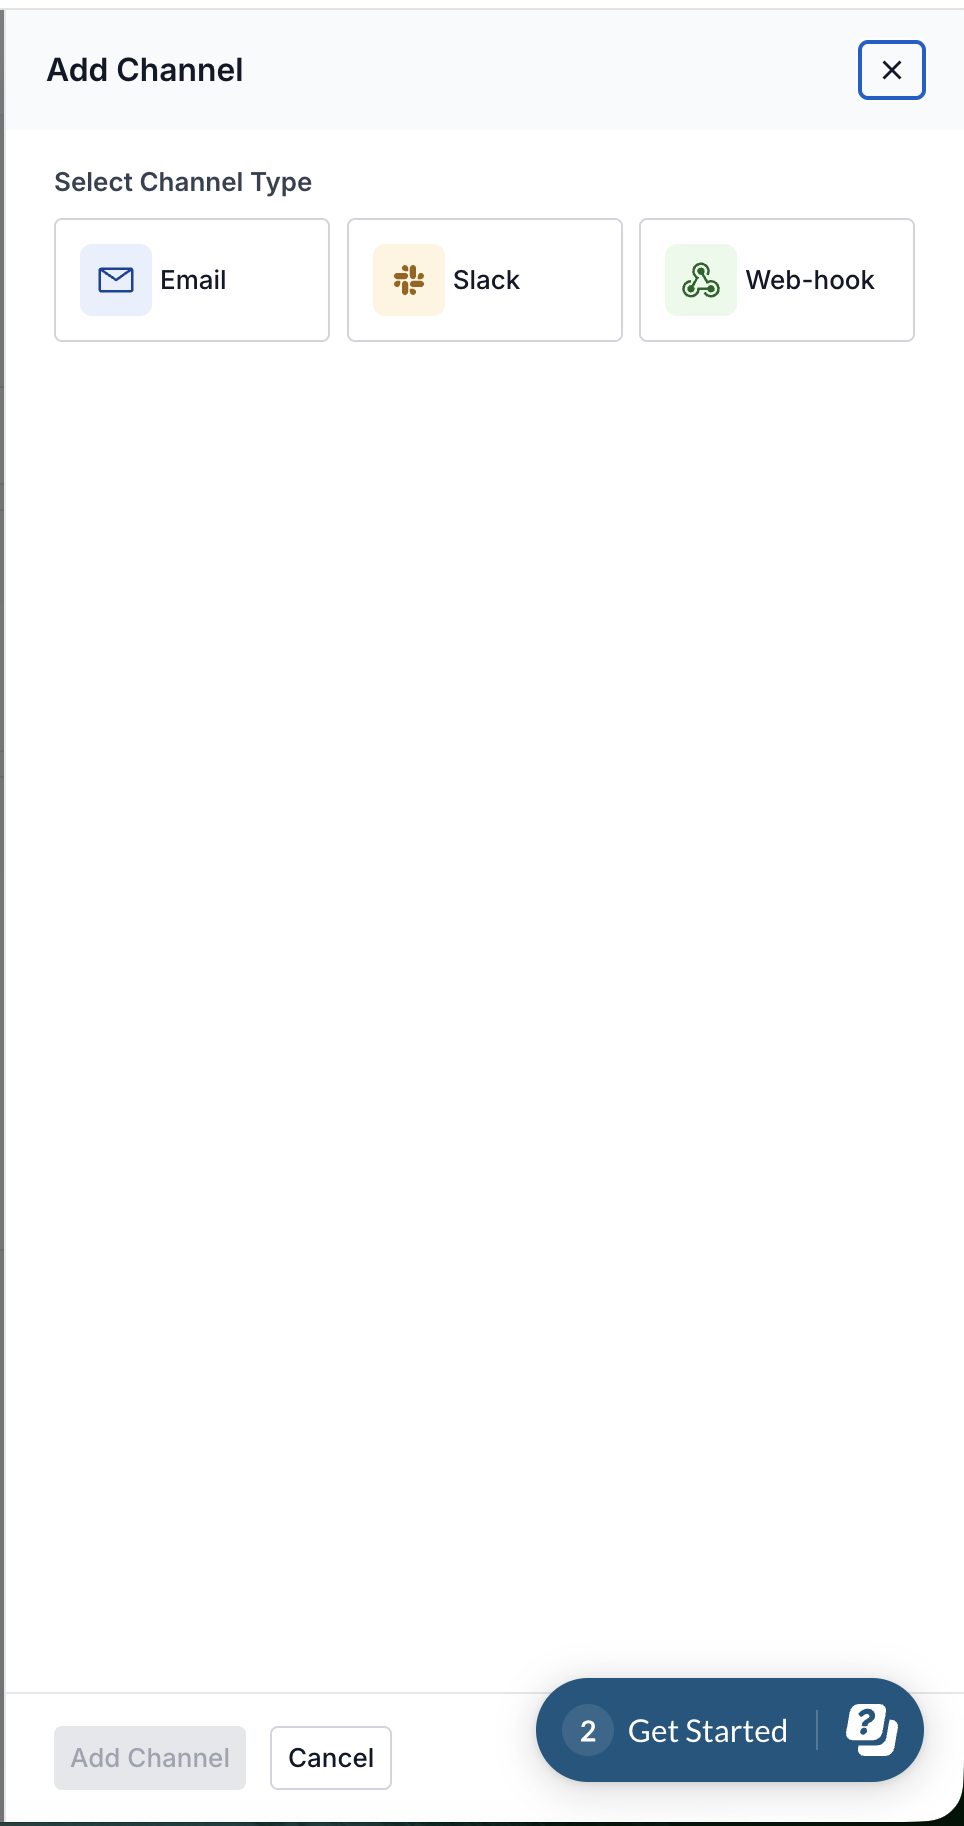
Figure 2 — Add Channel dialog
#### Delete a channel 1. Go to **Channel Settings** > **Channels**. 2. Select the ellipsis icon next to the channel, then select **Delete**. 3. Review the warning: deleting a channel permanently removes it, and any groups or policies attached to it will be affected. 4. Select **Delete Channel** to confirm. ### What is a channel group? A channel group bundles one or more channels together so you can attach them to a policy as a single unit, instead of selecting individual channels every time. For example, a channel group named "DBA On-Call" might include two email channels and a Slack channel that should all receive the same alerts. #### Create a channel group 1. Go to **Channel Settings** > **Channel Groups**. 2. Select **+ Create Channel Group**. 3. Enter a **Group Name**. 4. Under **Select Channels**, expand **Emails**, **Slack**, or **Webhook** and select the channels to include. 5. Select **Create Channel Group**. #### Edit a channel group 1. Go to **Channel Settings** > **Channel Groups**. 2. Select the ellipsis icon next to the group, then select **Edit**. 3. Update the **Group Name** or change the selected channels. 4. Select **Save Changes**. #### Delete a channel group 1. Go to **Channel Settings** > **Channel Groups**. 2. Select the ellipsis icon next to the group, then select **Delete**. 3. Review the warning: any policies attached to this group will stop delivering alerts and notifications immediately. 4. Select the **I understand the consequences, continue to action** check box. 5. Select **Delete Group** to confirm. *** ## Policies The **Policies** page lists every alert policy in your account, along with its status, rule type, subscriptions, and attached channel group. | Column | Description | | ---------------------- | ------------------------------------------------------------------- | | Policy name | The name given to the policy | | Status | **Active** or **Inactive** | | Rule type | **Metric** or **Operation** | | Subscriptions | The subscription(s) the policy monitors | | Channel Group Attached | The channel group notifications are sent to, or "No group attached" | | Last Modified On | Date and time of the last change | | Created by | The user who created the policy | You can filter the list by **Status**, **Subscription**, **Rule type**, and **Created by**, or search by policy name. ## How do I create an alert policy? Creating a policy in the Observability app is a three-step process: **Configure Rules**, **Policy Details**, and **Review Policy**. 1. Go to **Policies** and select **+ Create Policy**. 2. Complete [Step 1: Configure Rules](#step-1-configure-rules) (see below). 3. Complete [Step 2: Policy Details](#step-2-policy-details) (see below). 4. Complete [Step 3: Review Policy](#step-3-review-policy) and select **Create Policy**. ### Step 1: Configure Rules Define the monitoring scope by selecting a rule type and adding one or more rules. 1. Under **Rule type**, select either **Metric** or **Operation**. This choice applies to the entire policy — you cannot add both Metric and Operation rules to the same policy. 2. Select **Add Rules** > **Select a Metric** (or **Select a Operation**) to open the rule picker. 3. Configure the rule as described below, then select **Add Rule**. 4. Repeat to add more rules. Each added rule appears as a card showing its name, category, and configured severities, with **Edit** and **Delete** options. 5. Select **Continue to Details**. #### How do I configure a Metric rule? 1. In the metric picker, filter by **DB Metrics** or **OS Metrics**. * For DB Metrics, further filter by engine: **All**, **PostgreSQL**, **Oracle**, **SQL Server**, or **MySQL**. * For OS Metrics, further filter by OS: **All**, **Linux**, or **Windows**. 2. Select a metric category (for example, **CPU**, **Memory**, **Storage**) to see the available metrics, then select one. 3. Review the metric description shown on the rule card. 4. Under **Severity**, **Condition**, and **Threshold**, set the trigger logic — for example, Severity **Critical**, Condition **Equal to (=)**, Threshold **0**. 5. Optionally, select **Add New Severity** to define multiple severity levels with different thresholds for the same metric. 6. Set the **Evaluation Window (in mins)** — how long a condition must hold before the alert fires. 7. Select **Add Rule**.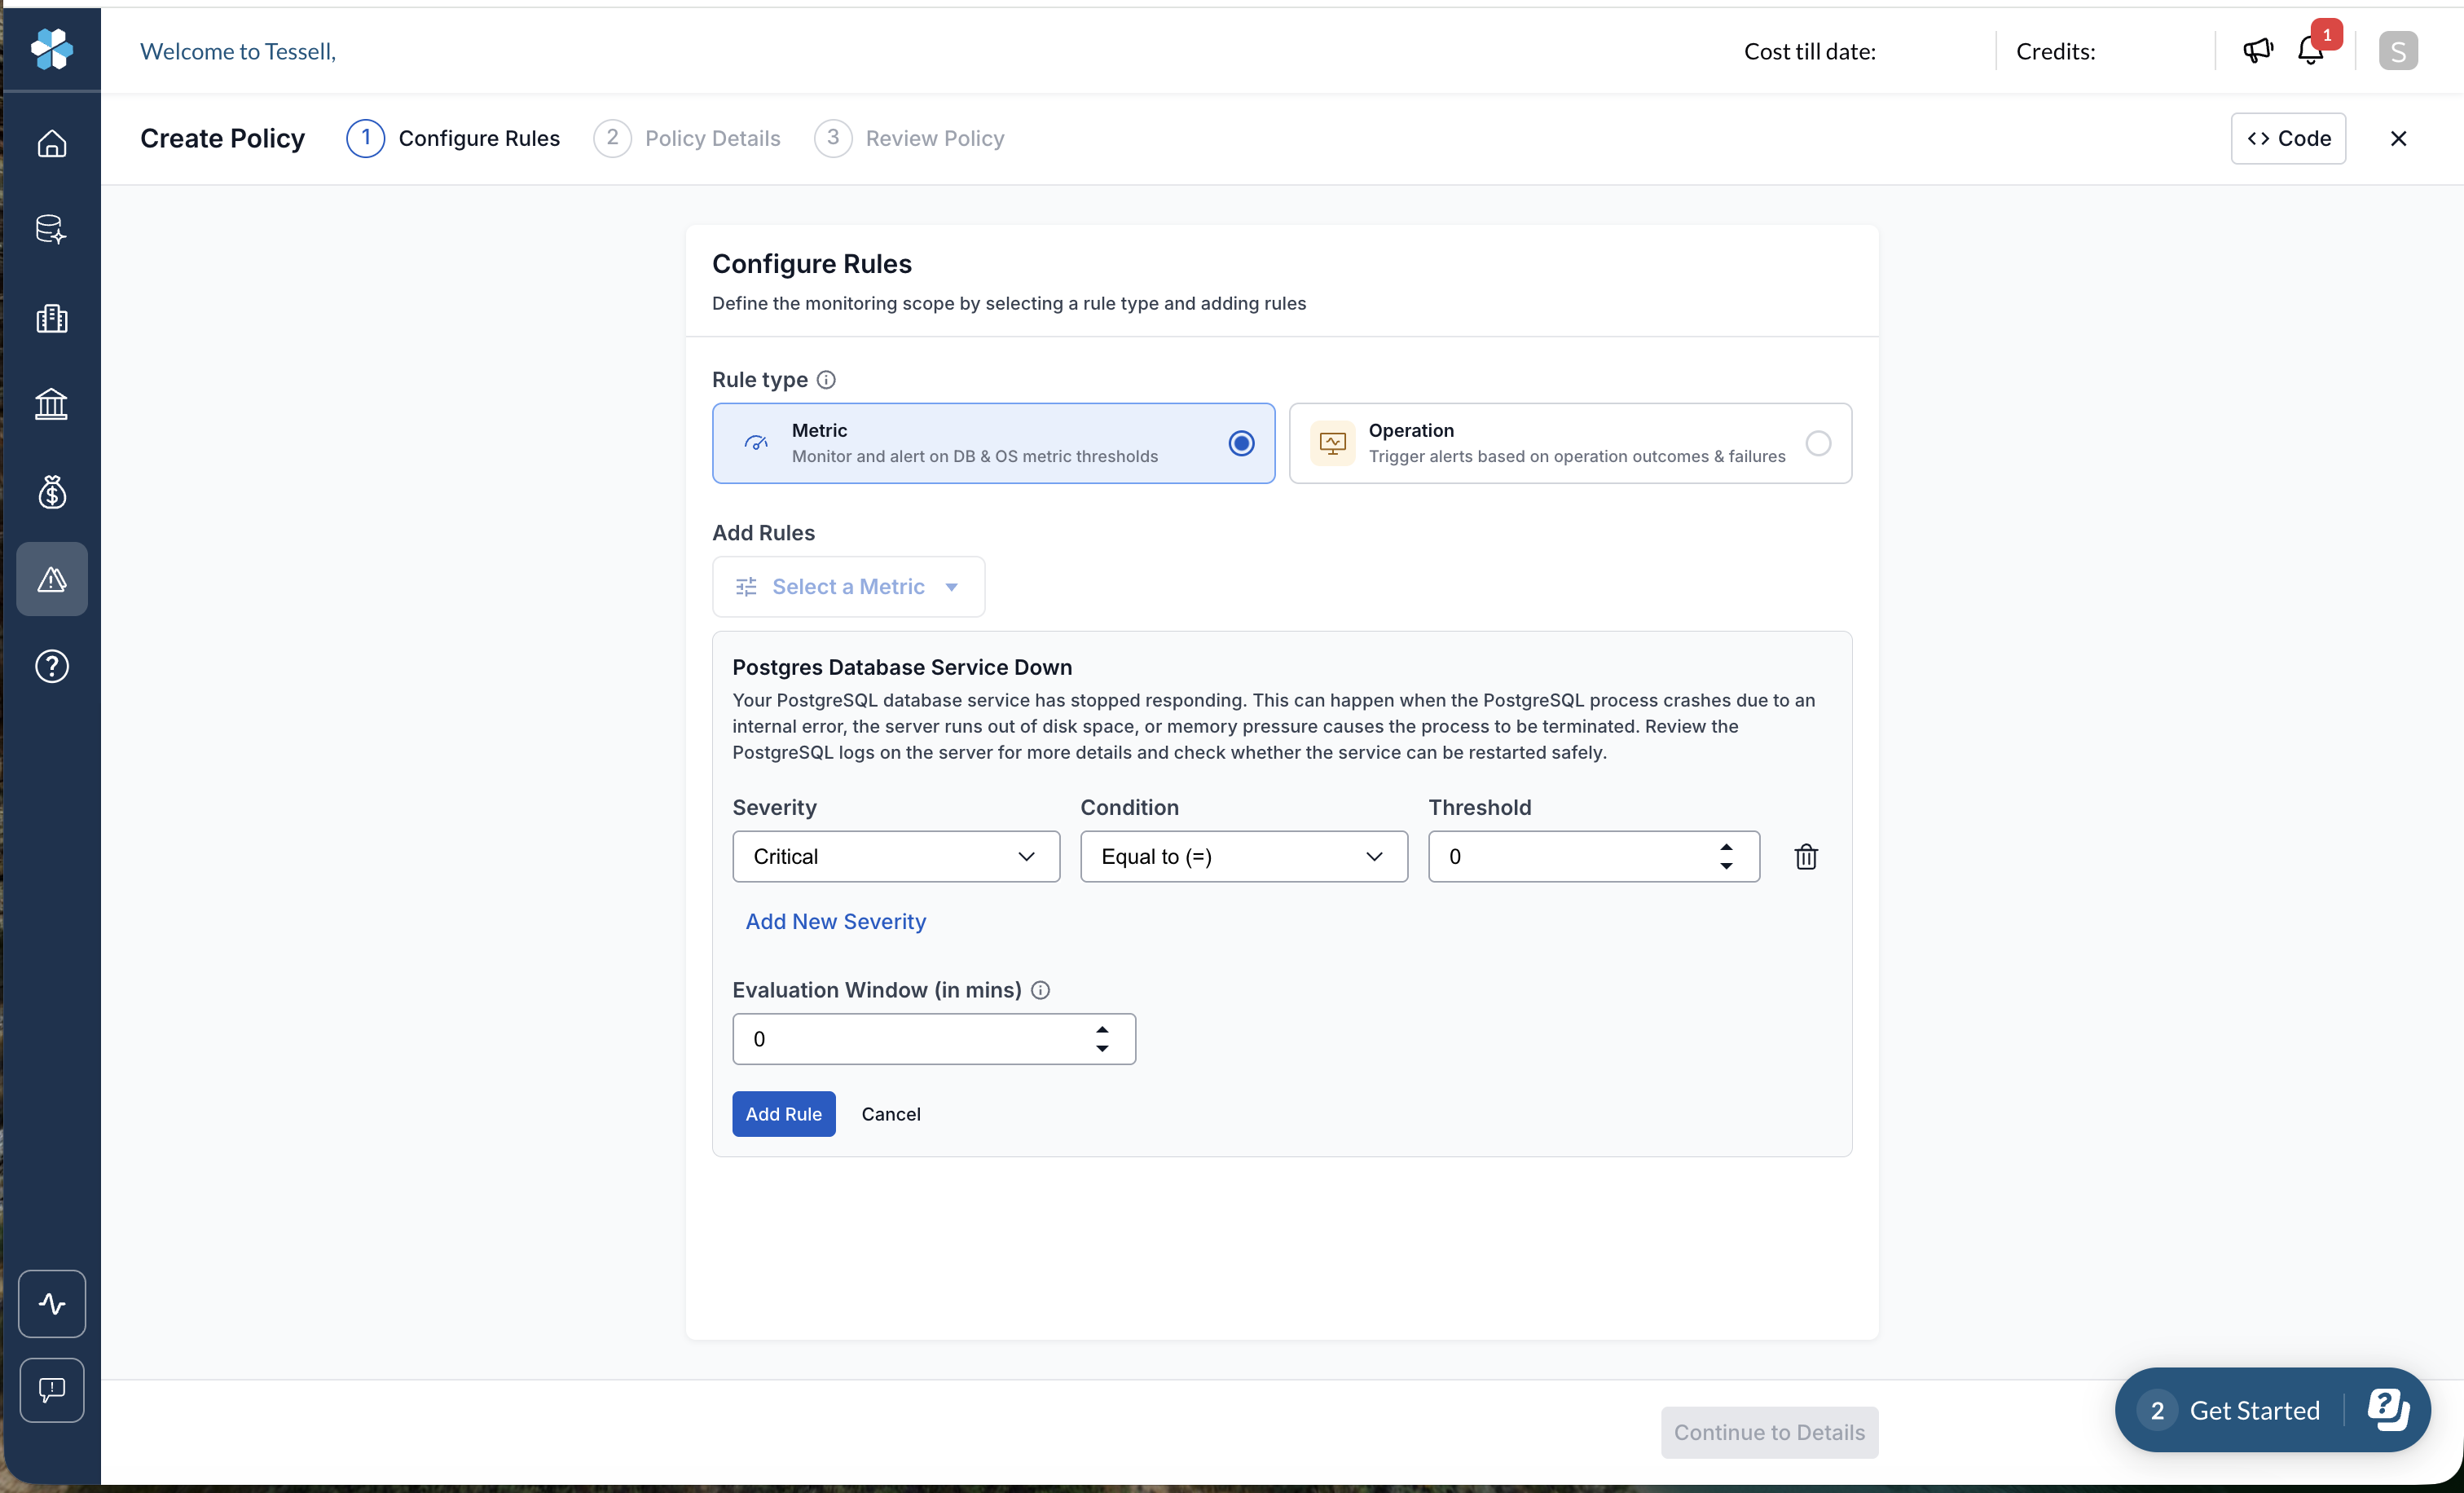
Figure 3 — Configuring a Metric rule
#### How do I configure an Operation rule? 1. In the operation picker, select a category to see the available operations, then select one. 2. For each rule, add one or more **Outcome** and **Severity** pairs — for example, Outcome **Success** with Severity **Info**, Outcome **Failed** with Severity **Warning**, Outcome **Running** with Severity **High**. 3. Optionally, select **Add New Severity** to add more outcome-severity pairs. Available severities are **Info**, **Warning**, **High**, and **Critical**. 4. Select **Add Rule**. **Available Operation categories:** | Category | Operations | | ------------ | ----------------------------------------------------------------- | | Provisioning | Provision Service | | Cloning | Clone Service | | Backup | DB Service Backup, Exadata DB Service Backup, DB Service Snapshot | | Switchover | Switchover Service | | Patching | Patch Service | | Resizing | Resize Service |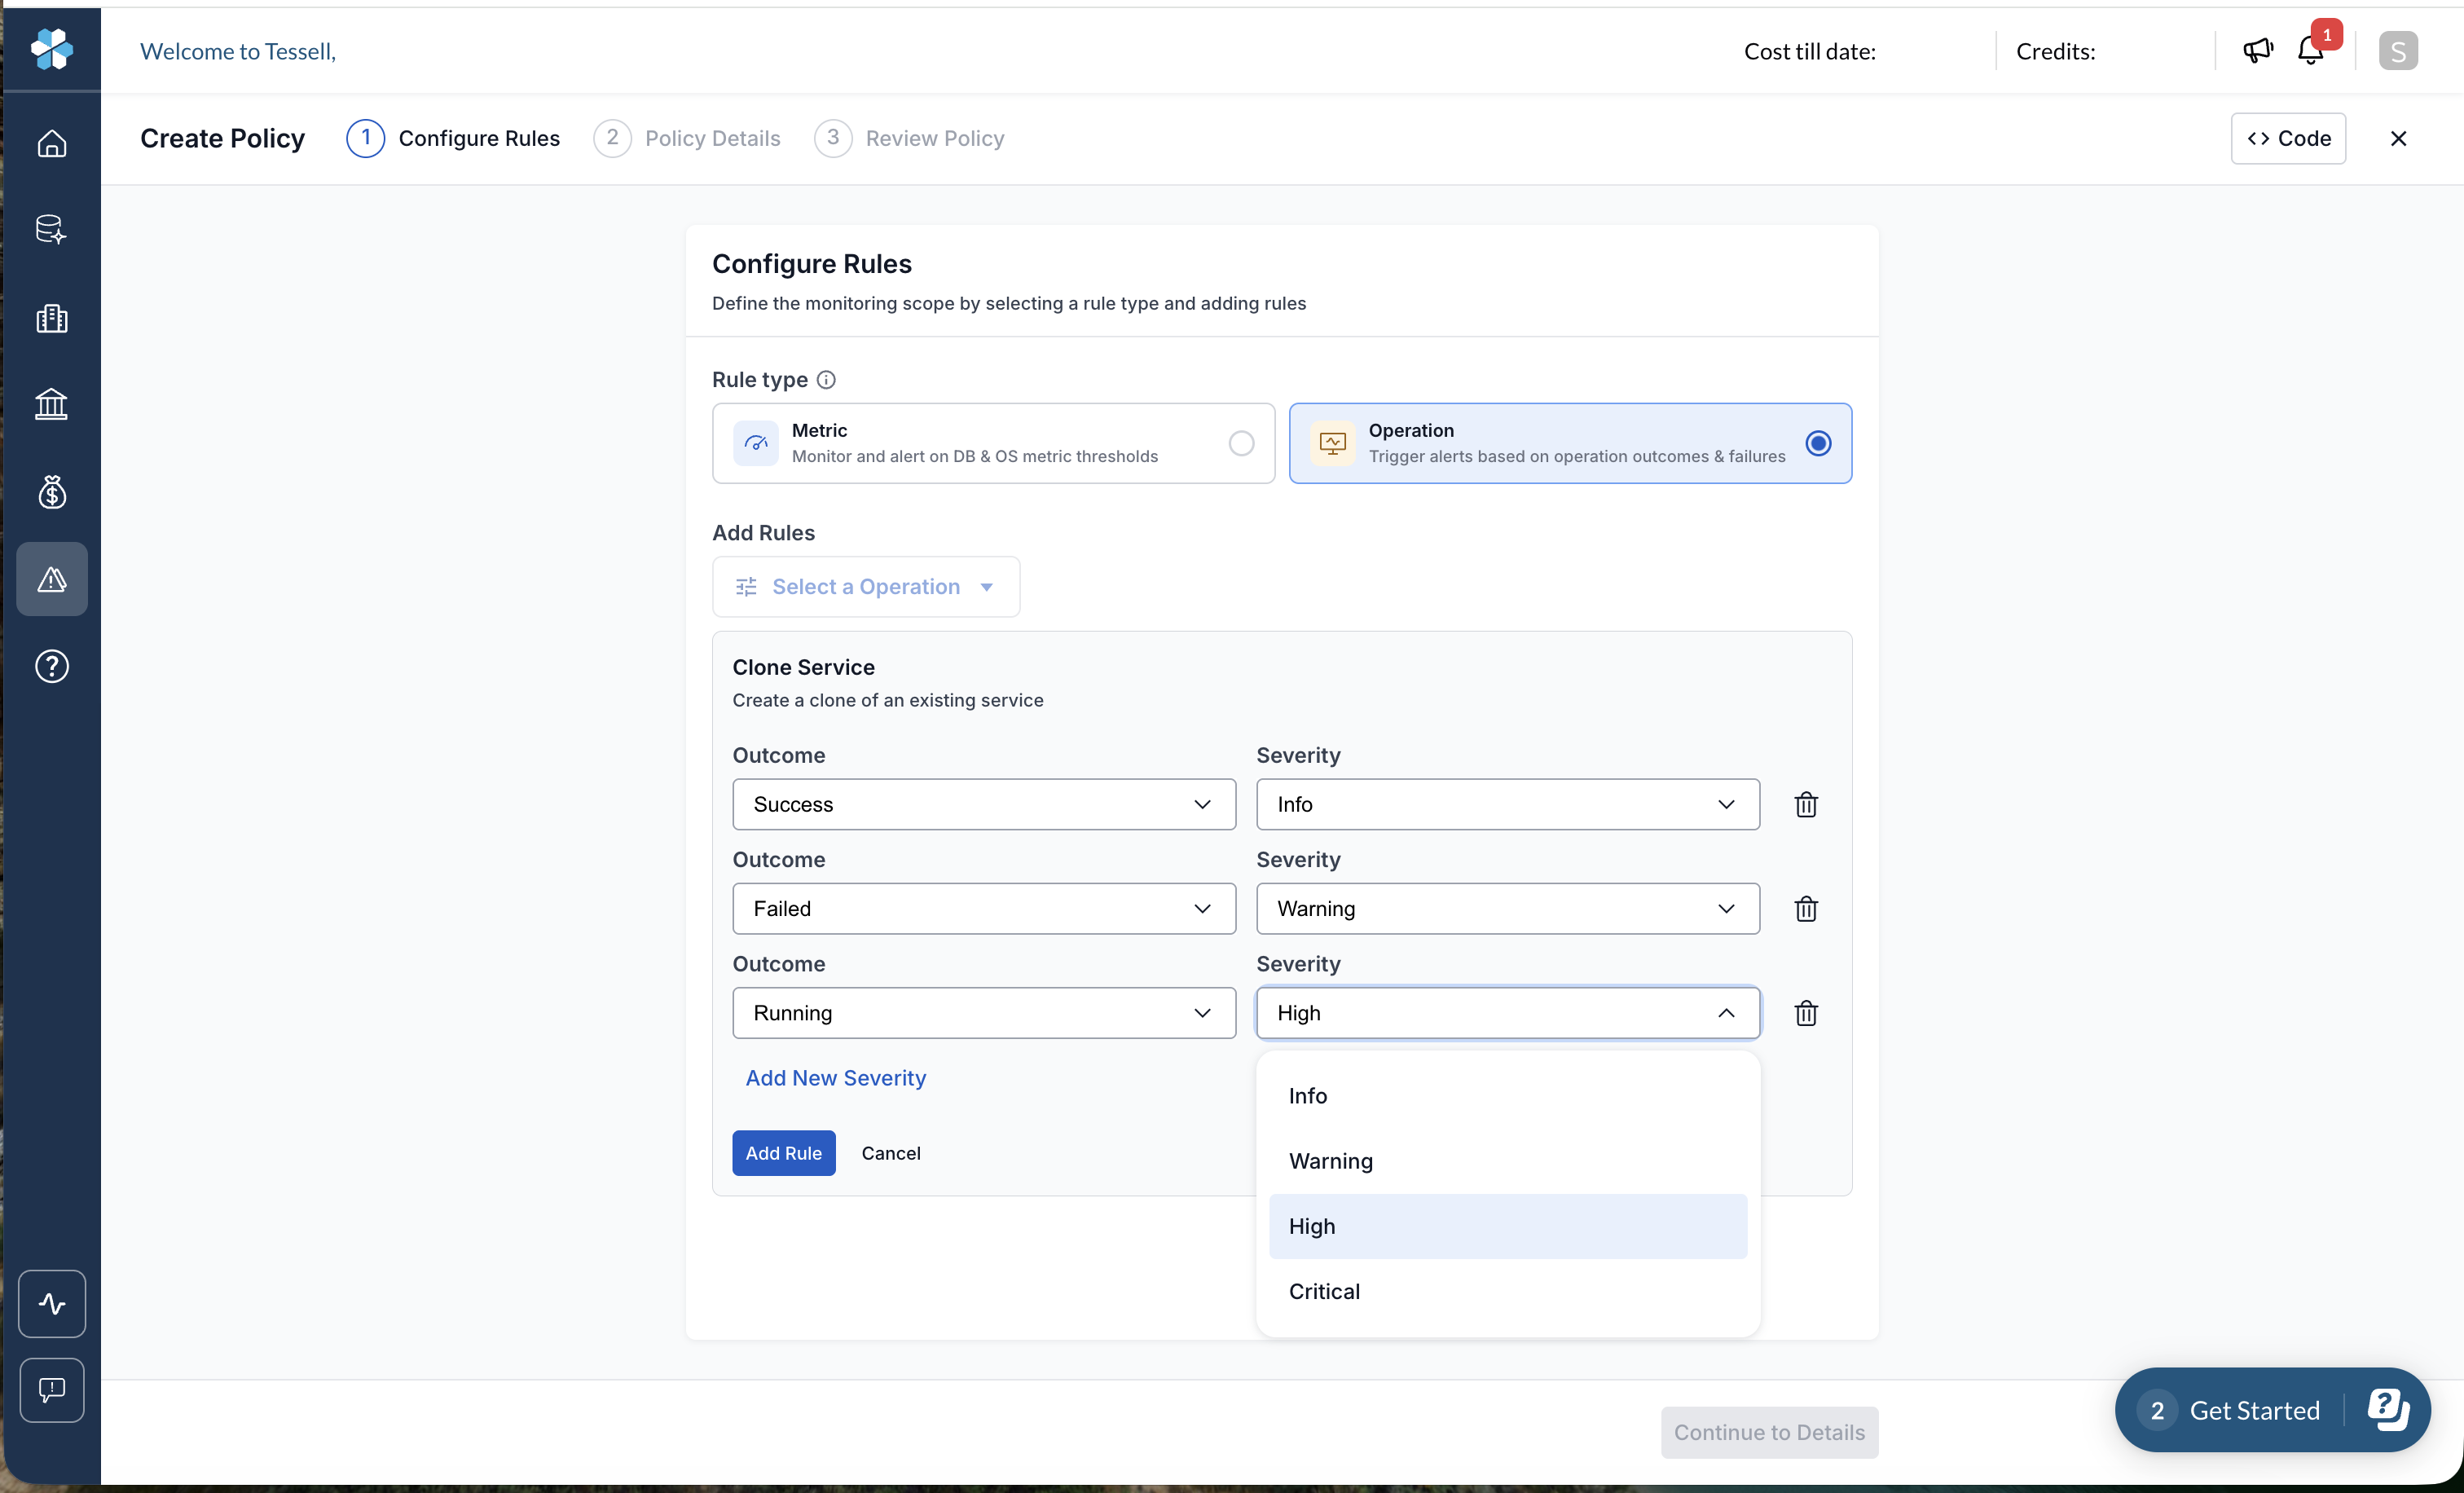
Figure 4 — Configuring an Operation rule
### Step 2: Policy Details Name your policy, select a subscription, attach a channel group, and configure your alert message. 1. Enter a **Policy name**. 2. Under **Subscriptions**, select one or more subscriptions this policy applies to. Selected subscriptions appear as removable chips. 3. Under **Channel group**, select the [channel group](#what-is-a-channel-group) that should receive notifications from this policy. 4. Review the **Default annotations** — these are automatically included in every alert message and vary based on the rule type (for example, Source Version, New Primary, Engine, Target Version, DB Service, Old Primary). 5. Optionally, turn on **Custom annotations** to add extra context to alert messages, such as a team name or escalation contact: 1. Choose **Static** for a fixed label and value, or **Dynamic** for a value that changes based on context. 2. Enter a **Label** and **Value** — for example, Label "Team", Value "DBA On-Call". 3. Select **Add Annotation**. 6. Select **Review Policy**. ### Step 3: Review Policy Review the full policy configuration before it goes live. The policy becomes active as soon as you create it. The review page shows: * **Configured Rules** — the rule type and the list of rules added in Step 1. * **Policy Details** — the policy name, subscriptions, channel group, and annotation counts. * **View Preview** — expand this to see exactly what the alert notification will look like (see [What does an alert notification look like?](#what-does-an-alert-notification-look-like)). Select **Create Policy** to finish, or **Back** to make changes. *** ## How do I view or manage an existing policy? Select a policy from the **Policies** list to open its details page. Here you can see its status, review who created and last updated it, and manage its rules, channel group, message, and subscriptions — all without recreating the policy. The policy details page has four tabs: **Rules**, **Channel Group Attached**, **Message**, and **Subscriptions**. ### Rules tab View all rules configured on the policy. Use **Search**, filter by **Severity**, or **Sort By** name to find a specific rule. * Select **+ Add Rules** to add more rules to the policy, following the same steps as in [Configure Rules](#step-1-configure-rules). New rules must match the policy's existing rule type — Metric or Operation. * Select **Edit Rules** to open the **Edit Rules** page: 1. Use **Search**, **Severity**, or **Sort By** to locate the rule you want to change. 2. Select **Edit** next to the rule, then update its severity, condition, threshold, or evaluation window as described in [Configure Rules](#step-1-configure-rules). 3. Select **Save Changes** to confirm the rule, or select the trash icon to remove the rule entirely. 4. After making all your changes, select **Save Changes** at the bottom of the page. ### Channel Group Attached tab View the channel group currently attached to the policy, including its name, channels, and when it was last modified. * Select the ellipsis icon next to the group, then select **Replace Group** to switch to a different channel group. Select a new group from the **Channel group** dropdown and select **Save Changes**. * Select the ellipsis icon, then select **Detach Group** to remove the channel group from this policy. Review the warning — members of the group will stop receiving alerts and notifications immediately, though the channel group itself is not deleted, only detached — then select **Detach group** to confirm. ### Message tab See a summary of the annotations included in the alert message: how many **Default** fields are auto-included, and how many **Custom** annotations have been added. * Select **View Alert Preview** to see exactly what the notification looks like across Email, Slack, and Webhook (see [What does an alert notification look like?](#what-does-an-alert-notification-look-like)). * Select **Edit** to open the **Edit Message** dialog: 1. Review the **Default annotations** — these vary depending on the rule type and metric or operation selected. For example, a metric-based policy might include fields like `service_instance_role`, `threshold`, `service_name`, `severity`, `tenant_name`, `alert_profile_name`, `tenant_id`, `alertname`, and `service_instance_id`. 2. Optionally, add a **Custom annotation**: choose **Static** or **Dynamic**, enter a **Label** and **Value** (for example, Label "Team", Value "DBA On-Call"), and select **Add Annotation**. 3. Select **Save Changes**. ### Subscriptions tab View the subscriptions this policy monitors, including their status, cloud provider, and number of DB services. * Select **+ Add Subscription** to attach another subscription: 1. From the **Subscriptions** dropdown, select the check box next to each subscription to add. 2. Select **Add Subscriptions**. * Select the ellipsis icon next to a subscription, then select **Detach Subscription** to remove it from the policy. Review the warning — any alerts currently firing for resources in this subscription will stop, though the subscription itself is not deleted, only detached — then select **Detach Subscription** to confirm. *** ## What does an alert notification look like? Select **View Preview** during policy review to see a live preview of the alert message across **Email**, **Slack**, and **Webhook** formats. A typical alert message includes: * A severity badge (**INFO**, **WARNING**, **HIGH**, or **CRITICAL**) * A summary line describing what triggered the alert, including the current value and threshold — for example, *"Clone Service - has increased to 95% (threshold: 80%)"* * The timestamp the alert was triggered * Key details: **DB Service**, **Node role**, **Policy** name, and **Rule name** * A **View details** button, plus links to **View Runbook** and **View Documentation** * A **Suggested Next Steps** section with recommended troubleshooting actions specific to the alert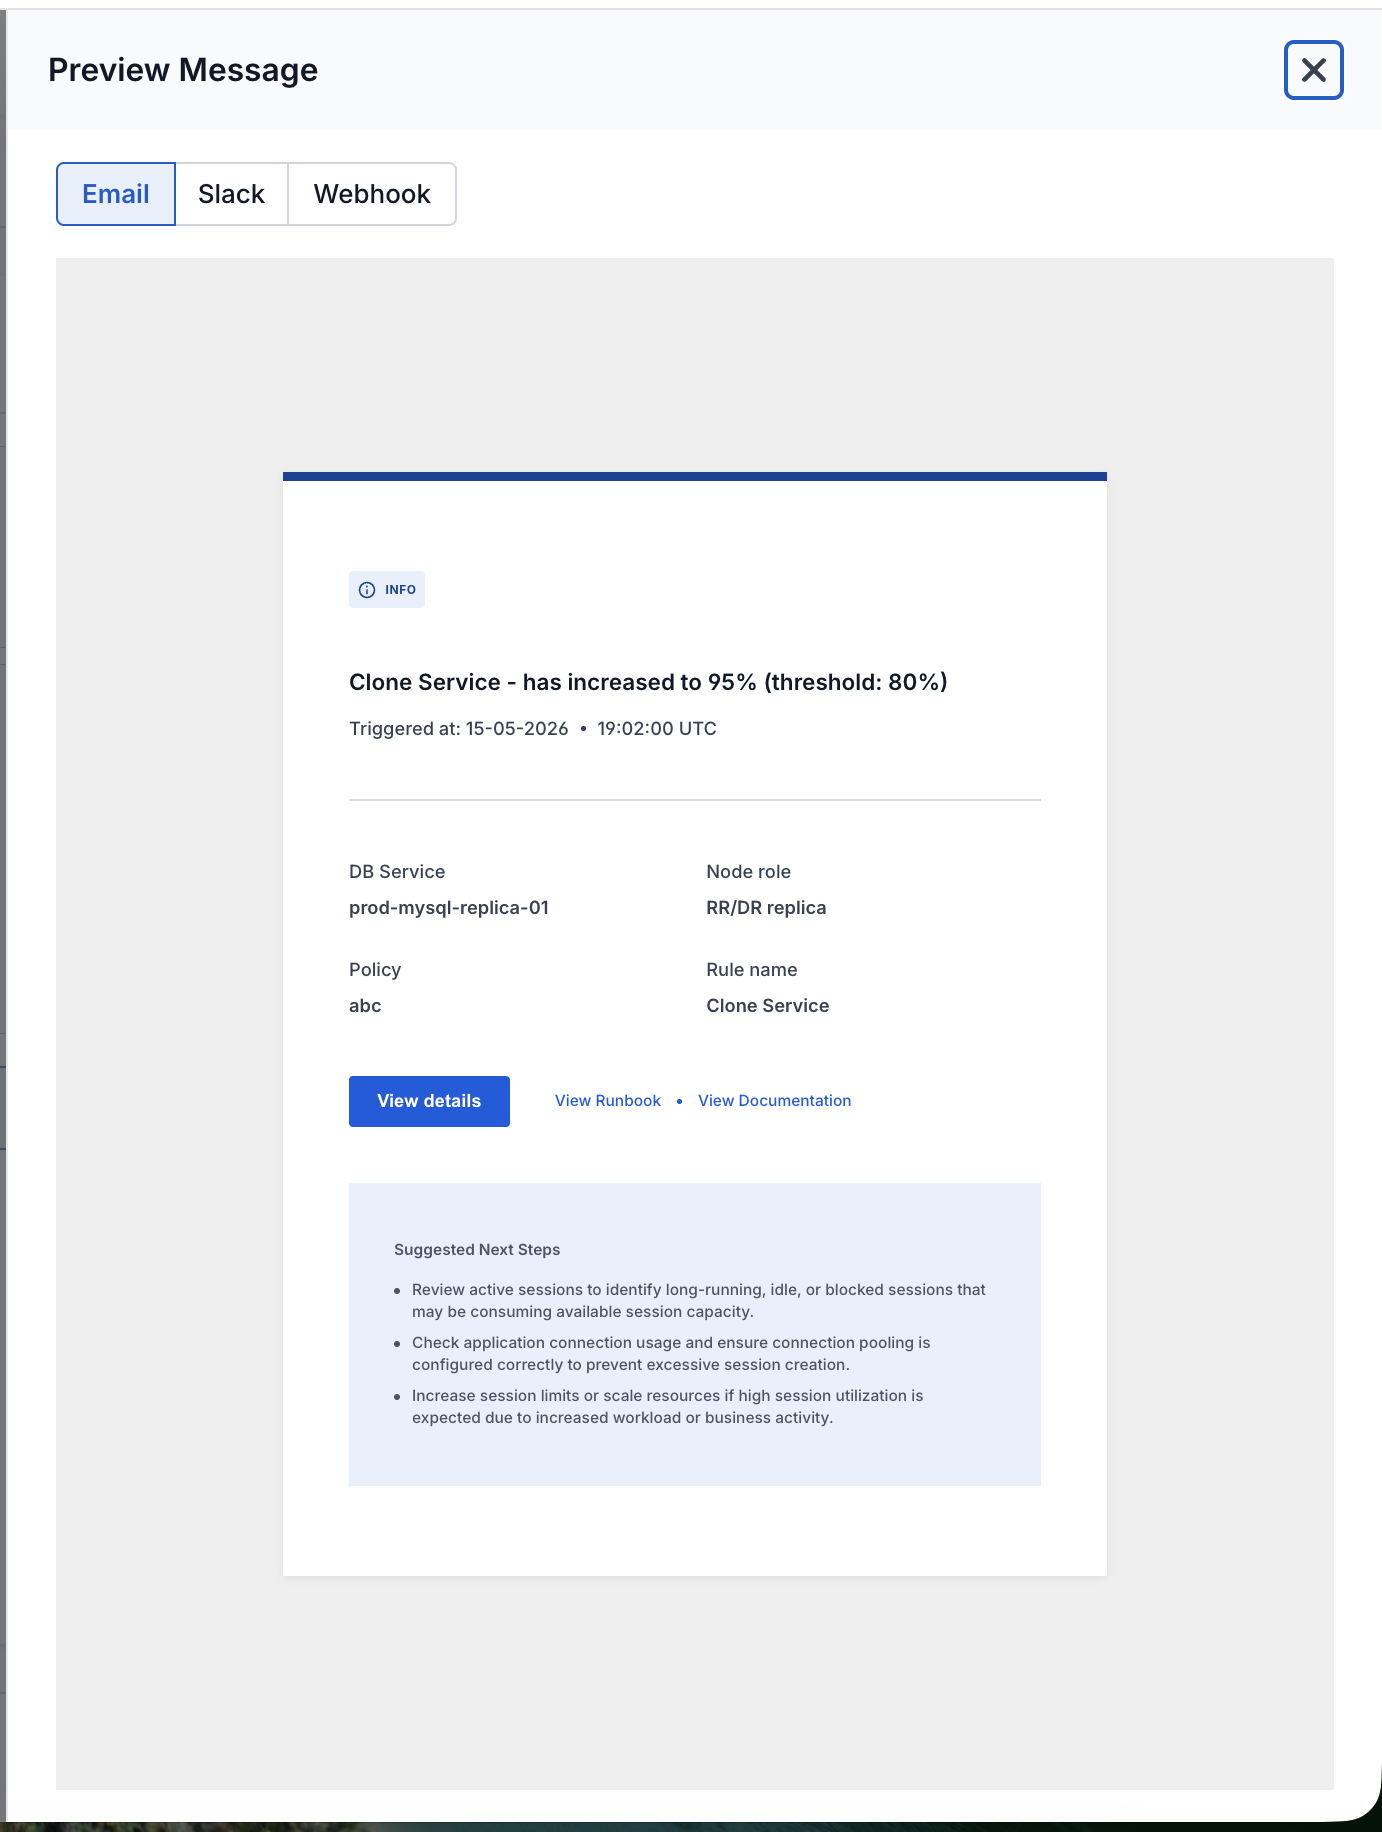
Figure 5 — Alert notification preview
## How do I delete an alert policy? 1. Go to **Policies**. 2. Select the ellipsis icon next to the policy, then select **Delete Policy**. 3. Review the warning: all rules, subscriptions, and configurations under this policy will be permanently removed. The channel group is not deleted — only detached. 4. Review the listed impact, such as which subscriptions will be removed and which channel group will be detached. 5. Select the **I understand the consequences, continue to action** check box. 6. Select **Delete Policy** to confirm. **Note:** Deleting a policy does not delete the channel group attached to it. The channel group remains available to attach to other policies. --- # Agent Instructions This documentation is published with GitBook. GitBook is the documentation platform designed so that both humans and AI agents can read, navigate, and reason over technical content effectively. Learn more at gitbook.com. ## Querying This Documentation If you need additional information that is not directly available in this page, you can query the documentation by asking a question. Perform an HTTP GET request on the following URL with the `ask` and `goal` query parameters: ``` GET https://docs.tessell.com/tessell/app-families/observability-doc.md?ask=